[INTRO]
Ham Solar is using code from Paul, N0NBH website. Its requires internet connection.
[SCREENSHOTS]


[HAP CHART]
Hourly Area Prediction (HAP) chart feature is also provided by this app. Its specifies the Maximum Usable Frequency (MUF) for HF communications between the base specified and any location on the map. The colors represent the MUF for communications between that location on the map and the base selected.
Thus, if communications are required to or from Minneapolis, a HAP chart for Minneapolis should be used. The other end of the circuit is then found on the HAP chart and the color at that location gives the MUF for that circuit.
HAP charts are charts based on current ionospheric conditions observed with ionosondes in the region of interest. This chart is only valid for the current hour due to the highly variable nature of the ionosphere.
It is also helpful to view HAP chart propagation from the perspective of distant locations. In this manner you can determine if they are able to reach the Midwest with a usable MUF.
[CHANGELOG]
| VERSION | DATE | CHANGES | |
|---|---|---|---|
| 2.4.5 | 14 November 2023 | - | Add follow url to Australian Space Weather Services. |
| - | Add follow url to HrdLog. | ||
| - | Add follow url to QRZ callsign database. | ||
| - | Fix HF band condition code. | ||
| - | Fix HAP chart map code. | ||
| - | Fix HrdLog QSO map code. | ||
| - | Fix QRX cluster code. | ||
| - | Fix setting code. | ||
| - | Remove clock component. | ||
| - | Update support for android SDK 33. | ||
| 2.4.4 | 22 July 2021 | - | Remove unnecessary code. |
| - | Fix problem to show HAP chart. | ||
| 2.4.3 | 21 July 2021 | - | Update contact us information. |
| - | Reduce image size. | ||
| 2.4.2 | 12 September 2020 | - | Update target API level requirement. |
| 2.4.1 | 2 July 2020 | - | Fix code with listview. |
| 2.4 | 2 June 2020 | - | Rewrite HamSolar server Url. |
| - | Reduce icon size. | ||
| 2.3.1 | 14 October 2019 | - | Rewrite HamSolar server Url. |
| - | Improve HAP chart viewer. | ||
| - | Remove indicator images. | ||
| 2.3 | 29 January 2019 | - | Reduce HamSolar size. |
| - | Migrate HamSolar server to new host server. Old HamSolar app will no longer function. | ||
| - | Fix typo Url in HamSolar code. | ||
| 2.2 | 29 November 2018 | - | Reduce HamSolar size. |
| - | Now all calculate method is done by HamSolar server. | ||
| - | HamSolar app no longer need special permission. | ||
| 2.1.3 | 20 November 2018 | - | Add code to redirect user to main "HamQSL" and "Rig-Reference" site when user click the image. |
| - | This update to support their site. | ||
| 2.1.2 | 19 November 2018 | - | Fix problem data image not display properly in some devices. |
| 2.1.1 | 18 November 2018 | - | Fix problem with Url. |
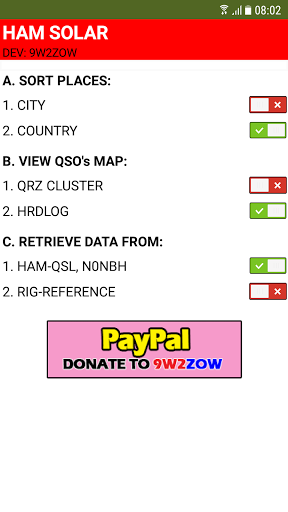
| - | Add option to choose whether to view datas from "HamQSL" or "Rig-Reference". Just configure it from "Settings" page. | ||
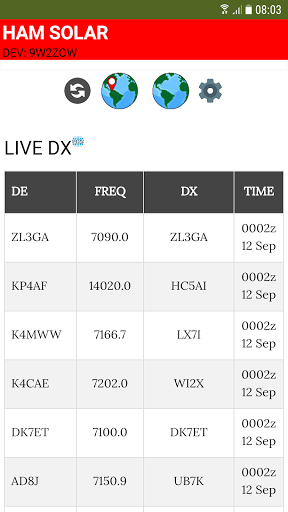
| 2.1 | 18 November 2018 | - | Add new rawInfo to show HF propagation. |
| - | Add new QRZ spot cluster. | ||
| 2.0 | 17 November 2018 | - | Add new graphic to show HF propagation. |
| - | Add base for new datas related HF from NOAA in future update. | ||
| - | Improve text quality. | ||
| - | Fixed problem with ListView text size. | ||
| 1.9 | 11 August 2018 | - | Add option show real-time worldwide QSO's map in two mode, "Google" or "Image". |
| - | Fixed problem with saving option. | ||
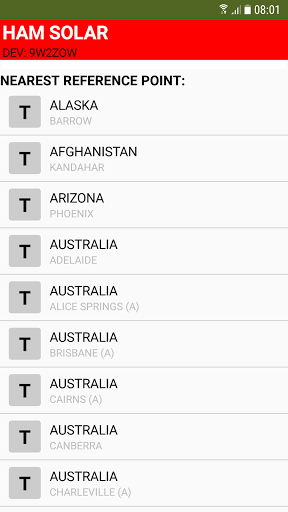
| 1.8 | 30 June 2018 | - | Add option to sort out all the nearest points list by "City" or "Country" name. |
| 1.7 | 5 May 2018 | - | Add global map to show real-time worldwide QSO's map. |
| - | Add donate function in settings page. | ||
| 1.6 | 24 February 2018 | - | Enable zoom on HAP Chart. |
| - | HAP chart image is more clear. | ||
| - | Optimize the code. | ||
| 1.5 | 4 December 2017 | - | Add 25 more cities located in Australasia for HAP Chart. |
| - | Add feature to save local city. Save your time when open HAP chart. | ||
| 1.4.1 | 29 October 2017 | - | Fix error when viewing HAP chart. |
| 1.4 | 25 October 2017 | - | Responsive image size. |
| - | Responsive text size. | ||
| - | Responsive button size. | ||
| - | Fix minor errors. | ||
| 1.3 | 18 October 2017 | - | Fixed problem with HAP chart url. |
| - | Now your screen will be changed to landscape automatically when you click HAP chart button. | ||
| - | Remove local html files. Now all are online, thus reduce the size of Ham Solar app. | ||
| - | Remove permission to read file. | ||
| - | Optimize the code. | ||
| 1.2 | 10 October 2017 | - | Fixed problem with auto-update solar propagation. |
| 1.1 | 19 July 2017 | - | Remove the 'Zmd94 Studio' text. |
| - | Relocate the 'Refresh' button to the top. | ||
| - | Adding 'Hourly Area Prediction (HAP) chart' feature. | ||
| - | Optimize the code. | ||
If you love this app, please kindly to rate it and give donation to Paul. This app is fully designed by using MIT App Inventor 2. Regards, 9W2ZOW.
Could use a few more upgrades in the future. Keep working on it and it will get better. It is pretty practical though in the first place. I like the app and the info is great. The way it reads out nice and simple for dummies like me. LoL 😆
Thank you so much for your review. Will keep upgrading HamSolar to be better in the future. Thank you again for using this app.
This one is wrong on 12/10 meter band is active now
Hello. Can I use it for Argentina HF prediction? Thanks in advance.
Hi, Juan. Thank you for using Ham Solar. Yes you can use it to predict HF propagation in Argentina.
Hi.
We are from Barcelona (Spain). Our nearest city in the app is Paris (France) at 700 Km. If it’s possible in new reviews, can you put some place in Spain please? Paris it’s too far. Like Barcelona, Madrid, Valencia Bilbao and Sevilla.
Thank you again!
Hi. Thank you for using Ham Solar. I’m really appreciate it. However the list of selection city is related to datas provided by Australian Space Weather Alert System. I will check from time to time, if there is new city is being added to the list.
Your project is very nice. Kindly add India Centric near reference point for HF propogation.
Thank you for using Ham Solar. I will try to add that reference point if it is available.
HAP chart appears not to be working.
Hi, Richard. Sorry for the problem. I’m working to fix it. Kindly wait for the update.